scheme-langserver
Debugging scheme-langserver
1. Enable Debug Logging
Magic Scheme
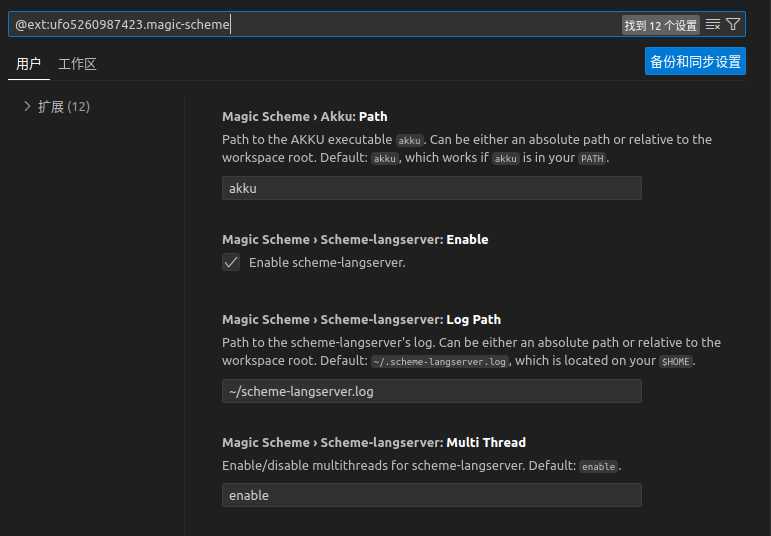
As shown in this figure, you may find Magic Scheme > Scheme-langserver: Log Path, and please give it an available path, so that you may know what scheme-langserver did wrong.
Lunar Vim
It’s convenient to add path-to-log-file and re-write file ~/.local/share/lunarvim/site/pack/packer/start/nvim-lspconfig/lua/lspconfig/server_configurations/scheme_langserver.lua as follows:
local util = require 'lspconfig.util'
local bin_name = '{path-to-run}'
local cmd = { bin_name ,"path-to-log-file"}

return {
  default_config = {
    cmd = cmd,
    filetypes = { 'scheme' },
    root_dir = util.find_git_ancestor,
    single_file_support = true,
  },
  docs = {
    description = [[
https://github.com/ufo5260987423/scheme-langserver
`scheme-langserver`, a language server protocol implementation for scheme
]]   ,
  },
}
2. Analyse Logs & Report Bugs
No matter who you are, for example an expert or a new schemer, if you want to debug scheme-langserver or issue a bug to the community, you will firstly analyse log.
Issue A Bug
Ok, you can make an issue here, AND DON’T FORGET
- Describe what’s wrong.
- Attach your log and project, so that the community can do detailed analysis.
- Wait.
Debug
If you’re an expert, you may recur the bug with log {path-to-log} and the replay scripts.
- You should have scheme-langserver’s source in
{path-to-scheme-langserver}and you can findbin/log-debug.sps(single-threaded) andbin/parallel-log-debug.sps(multi-threaded) there. - Rename
{path-to-log}, usually~/scheme-langserver.log, as~/ready-for-analyse.log.If your log is not
~/ready-for-analyse.log, you should do few modification to the replay script. - Run
cd {path-to-scheme-langserver}
scheme --script bin/log-debug.sps          # deterministic, single-threaded
scheme --script bin/parallel-log-debug.sps # concurrent, closer to real clients
or run them in a Scheme REPL. Mostly bugs will cause exceptions on screen.
See the detailed sections below for choosing between the two scripts, iterative printf debugging, and thread-safe printing tips.
If you’re an old-fashiond schemer, you may find this page helpful. But personally I use pretty-print to print useful informations.
A Better Bug Issue
OK, you may locate which your behavior cause crash or any other wrong, and reduce the size of code and log. And finally attach them in the issue.
scheme-langserver log replay debugging tools
bin/log-debug.sps and bin/parallel-log-debug.sps are log replay utilities. They read a previously captured LSP session log and feed it back into a fresh server instance, allowing you to reproduce crashes or misbehavior offline without a real language client.
1. Log file format
Both scripts expect a plain-text log at ~/ready-for-analyse.log. The log is produced by the server’s own debug logging and follows a simple line-oriented convention:
read-message— marks the start of an incoming LSP request/notification. The next line(s) contain the actual JSON-RPC payload.send-message(parallel mode only) — marks the end of a multi-line batch payload. All lines between the precedingread-messageand this marker are concatenated (with\n) into a single message.- Everything else is ignored.
Because JSON-RPC messages arrive with a Content-Length header in real I/O, the scripts reconstruct that header automatically:
Content-Length: <byte-length>\r\n\r\n<json-payload>
2. bin/log-debug.sps — single-threaded replay
| Aspect | Behaviour |
|---|---|
| Mode | Single-threaded (enable-multi-thread? #f) |
| Batch handling | No send-message support; each read-message is followed by exactly one payload line |
| Server args | (init-server input-port output-port log-port #f #t 'r6rs) |
| Expected result | Server does reach shutdown state (server-shutdown? → #t) when the input is exhausted |
Use this when you want a deterministic, linear replay without engine preemption or request-queue concurrency.
3. bin/parallel-log-debug.sps — multi-threaded replay
| Aspect | Behaviour |
|---|---|
| Mode | Multi-threaded (enable-multi-thread? #t) |
| Batch handling | Supports multi-line payloads delimited by send-message |
| Server args | (init-server input-port output-port log-port #t #t 'r6rs #t) |
| Expected result | Server does reach shutdown state (server-shutdown? → #t) |
This version runs the full threaded pipeline: thread-pool, request-queue, interval timer for diagnostic publishing, and engine-based time slicing. Use it to reproduce race conditions or cancellation bugs that only appear in multi-threaded mode.
4. Typical workflow
- Capture a failing session from a real editor client. The server writes debug logs to
~/scheme-langserver.logwhen debug mode is enabled. - Copy or symlink the log to
~/ready-for-analyse.log. - Run the appropriate replay script:
source .akku/bin/activate scheme --script bin/log-debug.sps # single-threaded scheme --script bin/parallel-log-debug.sps # multi-threaded - The script creates
~/scheme-langserver.log(server output log) and~/scheme-langserver.out(raw server stdout) for inspection.
5. Iterative printf debugging with replay
The most common way to use these scripts is not a one-shot replay. Instead, you iterate:
Goal: reproduce a crash or wrong result offline, then narrow down the culprit by adding print statements in the source.
Step-by-step
-
Obtain the log.
When a user (or your own editor) hits a bug, grab the server’s debug log. If the server was started without a log file, you can often reconstruct the JSON-RPC traffic from the client’s output (e.g. VS Code’s “Scheme Language Server” output panel). - Prepare
~/ready-for-analyse.log.cp /path/to/captured.log ~/ready-for-analyse.log - Verify reproduction.
source .akku/bin/activate
scheme --script bin/log-debug.sps
If the bug involves threading (races, cancellation, request-queue ordering), use
parallel-log-debug.spsinstead. - Pick a suspect module and add prints.
For example, if the symptom is a wrong identifier reference, openanalysis/identifier/rules/library-import.slsand add:(display "DEBUG: processing import ") (display identifier) (newline)Or use
pretty-printfor structured data:(pretty-print `(DEBUG: index-node= ,index-node references= ,refs)) - Clear the
.socache.
This is the #1 gotcha. Chez compiles libraries to.soobjects under.akku/libobj/. If you do not delete the cached object for the file you edited, the replay will silently run the old code.rm -rf .akku/libobj/scheme-langserver(See AGENTS.md §3 for a longer explanation.)
- Re-run the replay.
source .akku/bin/activate
scheme --script bin/log-debug.sps
Your new prints appear on the console (or in
~/scheme-langserver.logif the server redirects them). - Narrow the search.
- If the print does not fire → the code path you suspected is not taken; move your print upstream.
- If the print fires and the data looks wrong early → keep moving the print upstream until you find the first place where the value diverges from expectation.
- If the print fires and the data looks correct here but the final result is still wrong → move the print downstream.
-
Repeat 4–7 until you locate the root cause.
- Clean up.
Remove or comment out the debug prints before committing. If you added temporary state (e.g. a global counter), remove that too.
Thread-safe printing in parallel mode
When using parallel-log-debug.sps, multiple threads may print simultaneously, causing interleaved output. If this matters, wrap prints in the workspace mutex (or any other convenient mutex):
(with-mutex (workspace-mutex workspace)
  (display "DEBUG: ") (display value) (newline))
For quick-and-dirty debugging, raw interleaved output is usually still readable enough to tell which thread hit which breakpoint.
Choosing between single-threaded and multi-threaded replay
| Symptom | Use |
|---|---|
| Crash in abstract interpreter / identifier resolution / type inference | log-debug.sps first |
| Wrong request order, missing cancellation, duplicated publish-diagnostics | parallel-log-debug.sps |
| Hang or infinite loop | Try both; if parallel-log-debug.sps hangs but log-debug.sps does not, you have a threading bug |
request-queue assertion failure |
parallel-log-debug.sps |
If the single-threaded replay does not reproduce the bug, switch to the multi-threaded version. Conversely, if the multi-threaded version is too noisy to debug, try the single-threaded one to verify the core logic is correct in isolation.
6. Differences at a glance
log-debug.sps |
parallel-log-debug.sps |
|
|---|---|---|
| Threading | #f |
#t |
| Debug mode | #t (6th arg) |
#t (7th arg) |
Batch (send-message) |
❌ | ✅ |
| Shutdown assertion | #f |
#t |
7. Notes
- Both scripts are not run by
test.shautomatically. They are standalone diagnostic tools that require a manually prepared~/ready-for-analyse.log. - The
Content-Lengthheader is reconstructed in-memory; the original log does not need to contain it. - Both versions will observe
server-shutdown?becoming#tonce the input is exhausted, regardless of whether the log contains ashutdownrequest.
8. Shutdown / exit handling
Status: Fixed in the
kimibranch.
The server’s shutdown/exit lifecycle now complies with the LSP specification.
| Message | Type | Server behaviour (current) |
|---|---|---|
shutdown |
Request (requires response) | Sets server-shutdown? to #t and sends a null result response. |
exit |
Notification (no response) | Terminates the Chez process with exit code 0 if shutdown was received earlier, otherwise 1. |
Any request after shutdown |
— | Returns InvalidRequest (-32600) except for exit, which terminates the process. |
initialize after shutdown |
— | Rejected with InvalidRequest. |
Key fixes applied to scheme-langserver.sls:
- Removed the special
shutdown/exitbranch in the main I/O loop; both messages now flow through the normal request processor. process-requesthandlesshutdowninside thecase methoddispatch: it sets the flag and sends(success-response id 'null).process-requesthandlesexitwith(exit (if (server-shutdown? server-instance) 0 1)).- Post-shutdown guard now rejects all methods except
exitwithInvalidRequest(previously it exemptedinitializeand used the wrong error codeserver-not-initialized).
Impact on the replay scripts
- Single-threaded (
log-debug.sps) — if the log containsshutdown, the server will send the required response and then continue until EOF.server-shutdown?will be#tat the end. - Multi-threaded (
parallel-log-debug.sps) — the consumer thread exits whenserver-shutdown?is#tand the request queue is empty. Becauseshutdownnow produces a response, the queue drains correctly and the test finishes reliably.